


NASA
USGS
Copernicus
Open Street Map
Climate change is disrupting resources, limiting access, and effecting the quality of food all around the globe. Observing trends in vegetation and water, and developing predictive AI, is a clear path for managing agriculture, food, and water availability in the coming years.
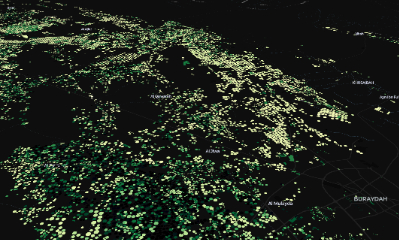
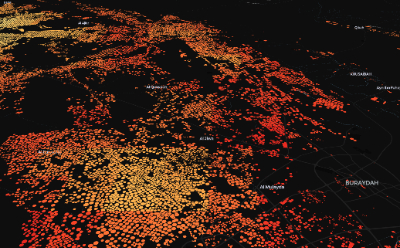
The normalized difference vegetation index (NDVI) is a measure of vegetation health that is an important indicator of agricultural productivity. Our NDVI dataset uses nearly four decades of satellite measurements of energy reflected by plants to infer photosynthetic activity and provides information about the health of crops across Saudi Arabia.
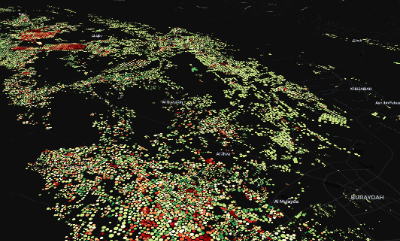
The normalized difference vegetation index (NDVI) is a measure of vegetation health that is an important indicator of agricultural productivity. Our trend maps of NDVI provide information on how agricultural crop health and productivity has changed over each of the past four decades.
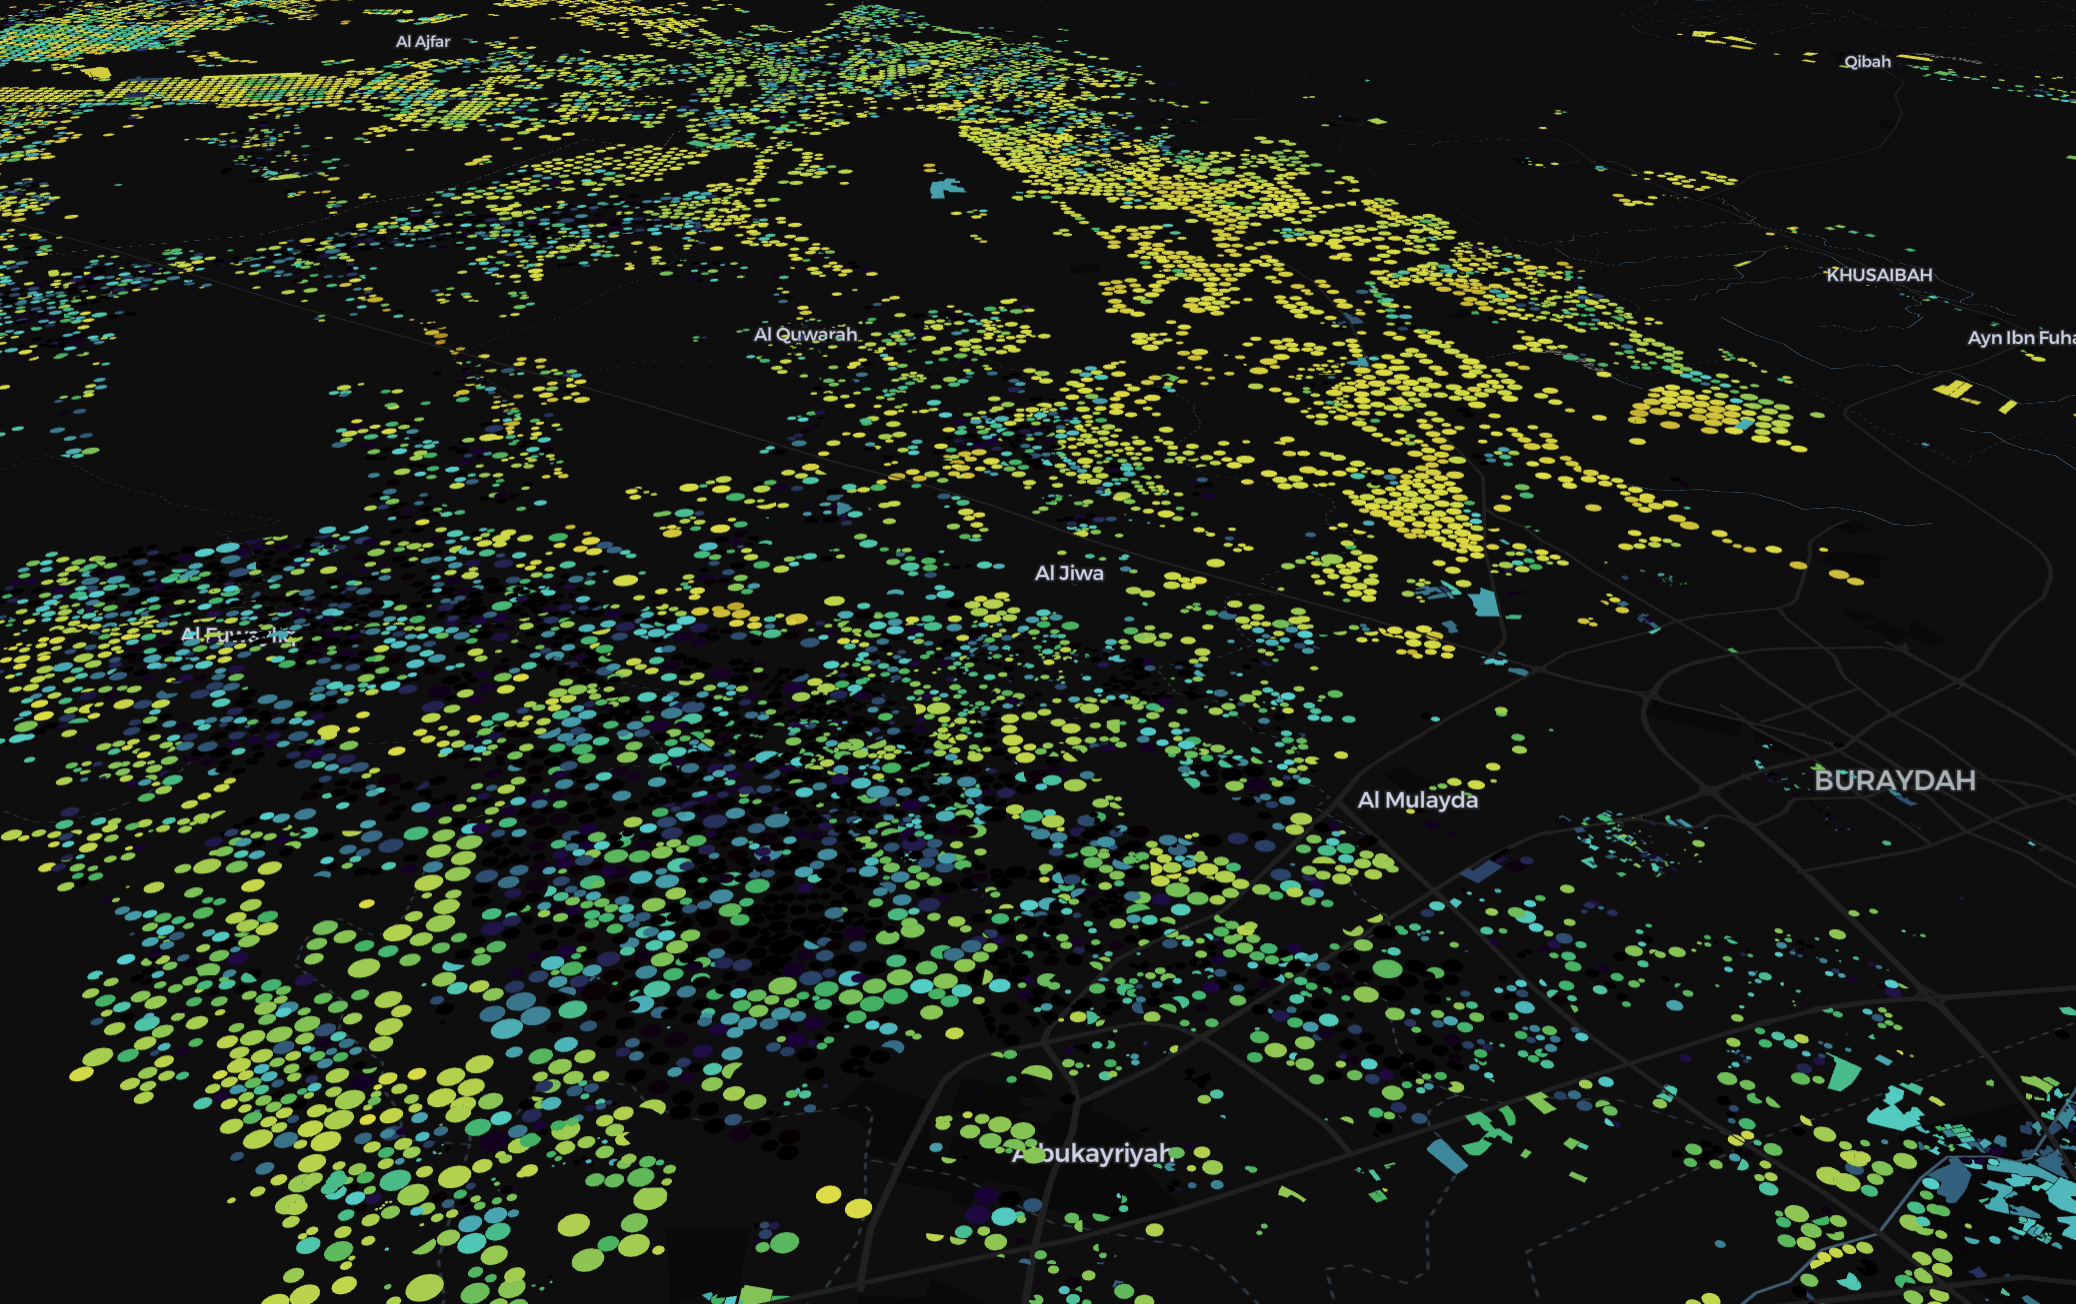
Evapotranspiration (ET) is the combination of transpiration from vegetation and evaporation from soil and provides important information about water use from agricultural activities in Saudi Arabia. Our ET dataset is produced using a model that relies on spatial weather data and nearly four decades of satellite images and climate data.
Evapotranspiration (ET) is the combination of transpiration from vegetation and evaporation from soil and provides important information about water use from agricultural activities in Saudi Arabia. Our trend maps of ET provide information on how agricultural water use has changed over each of the past four decades.
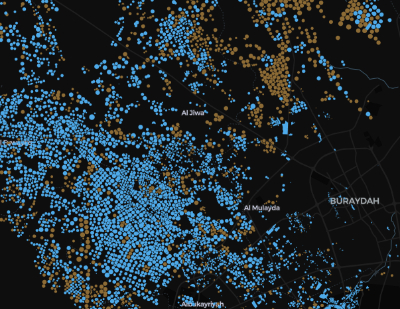
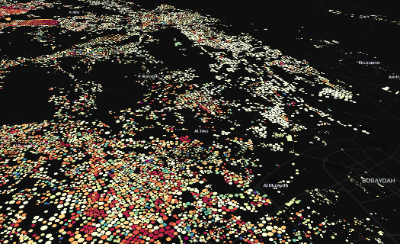
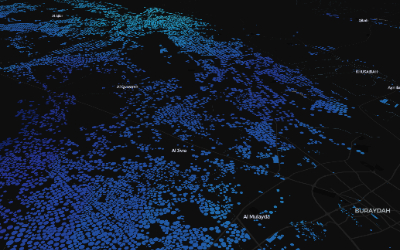
Agricultural fields are some of the most striking landmarks on Saudi Arabian landscapes because of the irrigation that they receive. Our irrigation dataset compiles nearly four decades of satellite observations of plant productivity to provide maps of which fields were irrigated and not irrigated each year.
Reference evapotranspiration represents evaporative demand or 'atmospheric thirst' for water. As such, reference evapotranspiration is important for design and scheduling of irrigation systems, and supports calculation of water use from agriculture, riparian areas, wetlands, open water bodies, and vegetated landscapes. Our reference evapotranspiration dataset uses 40 years of daily climate data to provide annual estimates for all of Saudi Arabia.
NASA
Fathom
Microsoft
Extremes in temperature and precipitation are impacting our lives more and more each year. Urban and suburban areas around cities are often affected by extreme building temperatures and lay at risk to extreme flooding events. Using decades of climate data, trends and risks are uncovered.
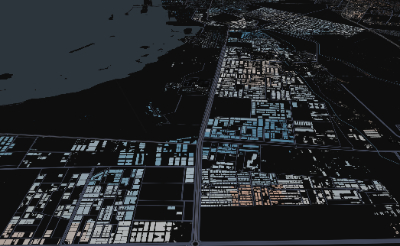
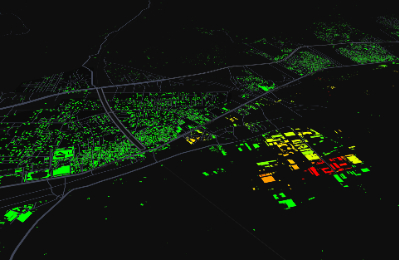
Land surface temperature (LST) is the radiative temperature of the land and is measured here using satellite observations of thermal energy emitted from the Earth's surface. LST maps developed show trends in median LST for the months of June, July, and August (JJA) from 2000-present. Locations where median JJA LST is increasing and decreasing over the period of record provides information on land use and land cover change impacts on excess heating and evaporative cooling.
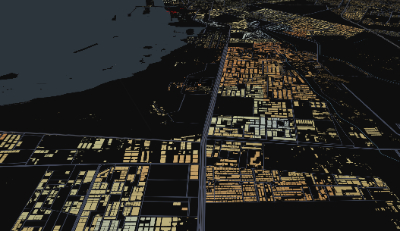
Land surface temperature (LST) is the radiative temperature of the land and is measured here using satellite observations of thermal energy emitted from the Earth's surface. This map shows median LST for the months of June, July, and August (JJA) 2022 relative to the JJA median LST from 2000-2021. As such, it shows areas that have had above- and below-average LST during JJA 2022, and provides in formation about which areas are experiencing extreme heat due to climate and or land use and land cover change.
Floods can be hazardous and damaging events, even in the arid environment of Jeddah in Saudi Arabia. These maps show modeled flood depth based on different frequencies of flood returns: 1 in 10 years, 1 in 100 years, 1 in 250 years, 1 in 500 years, and 1 in 1000 years. They demonstrate risks to assets, infrastructure, and ecosystems as a result of inundation during extreme precipitation events.
Precipitation is the primary water supply for reservoirs, streams, wetlands, and groundwater aquifers, and offsets irrigation demands for agricultural lands in Saudi Arabia. Our precipitation datasets draw on hourly weather models and observations that are summed each year to provide rainfall maps over nearly four decades.
European Space Agency
World Resources Institute
Landscapes are categorized by a variety of natural and human-made physical land types such as trees, crops, and buildings. By comparing land cover and use maps over time, decision makers and planners can observe changes to land and better predict future changes.
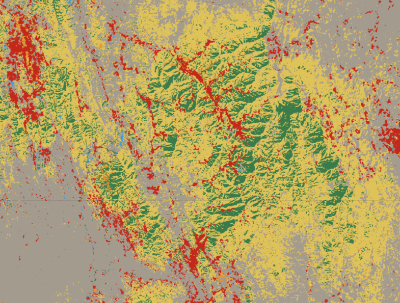
Changes in land use and landcover can result from human impacts and developments as well as environmental changes. The maps displayed here are derived from satellite imagery and AI models and show variability in land cover and land use for each year from 2015-2022. The AI model applied to produce this dataset uses thousands of satellite images to infer the most likely land cover and land use class for each year for every location in Saudi Arabia.
Copernicus
Drought conditions are becoming more extreme and longer in duration. These climatic events impact communities large and small and can cause long-term public health problems due to shortages in drinking water, impacts to air and water quality, and limitations to food and nutrition.
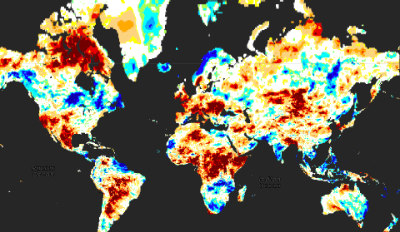
The Standard Precipitation Index (SPI) is a drought metric that quantifies departures in observed precipitation relative to a historical period of record, and is closely related to soil moisture, rangeland vegetation, and hydrologic conditions. SPI maps developed represent deviations of total precipitation for the period January 1 - August 13 of 2022 relative to the entire period of record from 1979-2021, providing a near real-time perspective of global drought conditions.
